|
|
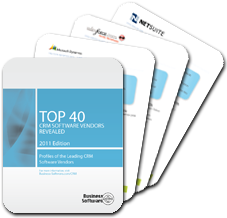
Compare Sage to other leading vendors in the 2012 Top 40 CRM Report
Making effective, timely business decisions requires access to key performance indicators at all levels of your organization. Sage SalesLogix provides powerful business intelligence capabilities, including Sage SalesLogix Visual Analyzer, Dashboard, and Packaged and Custom Reports.
Sage SalesLogix Visual Analyzer – Interactive, Customized Dashboards
Sage SalesLogix Visual Analyzer is a comprehensive, interactive business analytics tool that transforms your Sage SalesLogix data into actionable information.
Dashboards
Sage SalesLogix Dashboards provide a single location for instantly accessing the sales reporting information critical to your success, such as top opportunities, closed deals, and other key indicators.
Packaged & Custom Reporting
SalesLogix also includes more than 70 pre-built reports covering key performance indicators across sales, marketing, service, and support, as well as extensive custom reporting capabilities.
Sage SalesLogix Dashboards and Reporting
Sage SalesLogix Dashboards and Reporting capabilities deliver real-time access to key performance indicators, including sales reporting, marketing campaign effectiveness and service delivery metrics. Sage SalesLogix is an integrated customer relationship management (CRM) suite that includes Sales, Marketing, Customer Service, Support, and Mobile automation solutions.
For Executive Management
Turn insight into action by quickly analyzing performance, diagnosing potential problems, and identifying opportunities. Sage SalesLogix Dashboards provide a single, interactive location from which to view and analyze performance metrics from across your entire organization. Sage SalesLogix also includes more than 70 pre-built reports covering key performance indicators across sales, marketing, service, and support, as well as extensive custom reporting capabilities.
SAGE SALESLOGIX DASHBOARDS AND REPORTING KEY FEATURES |
- Pipeline Analysis
- Top Opportunities
- Closed Sales to Date
- Win/Loss Analysis
- Key Performance Indicators
|
|
- Product Sales Performance
- Calendar and Activity Views
- Drill-down Analysis
- Pre-built and Custom
- Sales Reporting
|
|
| |
For Sales Management
Powerful sales reporting capabilities deliver a real-time view of the sales pipeline in order to address weak areas and focus on top opportunities.
Utilize dashboards and sales reporting data to analyze team performance and win rates, to identify strengths and weaknesses for sales reps, regions, and other dimensions. |
Once you’ve identified an area that you want to analyze further, you can easily conduct historical and comparative analyses within your dashboards. You can also personalize your dashboards by simply dragging-and-dropping new content or selecting new filter criteria.
For Sales Professionals
Sage SalesLogix Dashboards provide a single location for instantly accessing the sales reporting information critical to your success, such as top opportunities, closed deals, and other key indicators. Drill-down capabilities enable you to analyze specific data points in more detail, including accessing the related Sage SalesLogix records. Calendar and activity views in Sage SalesLogix Dashboards help you manage your day-to-day activities and focus on your top priority tasks.
FEATURES OF DASHBOARDS
Real-Time, Interactive Dashboards
- Gain deep insight into organizational and individual performance
- Access a single location to view performance metrics, diagnose key issues, and identify opportunities
- Analyze key performance metrics such as pipeline status, open opportunities, and win rate
- Identify top customers and opportunities
- Discover root causes for performance issues and take corrective action
- Perform ad-hoc analysis by simply changing filter or group criteria
- Drag-and-drop to view different performance metrics on the dashboards
- Create customized content in dashboards
Drill-Down Analysis
- Drill down into detailed data for further analysis into trends
- Export sales reporting data to Excel and other popular formats for further analysis
- Conduct historical and comparative trend analyses, such as period-to-date and year-to-year
- Manage your calendar, tasks, and activities directly within the dashboards
- Personalize dashboards so each user gets exactly the information they need
Pre-Built and Custom Reports
- Access more than 70 pre-built reports or create custom reports with Crystal Reports
- Create report profiles for the common layouts you use in your company
- Control sales reporting output and distribution through easily defined filters, including existing dynamic groups
- Create Custom reports with Crystal Reports Designer
- Export report data to Excel and other popular formats for further analysis
Compare Sage to:
Maximizer,
Entellium,
Oncontact,
Aplicor,
Soffront,
ADAPT Software,
Avidian,
Epicor,
InsideSales.com,
Kana,
Microsoft,
NetSuite,
Oracle,
Parature,
RightNow,
Salesboom,
Salesforce.com,
SalesLogix,
Saratoga Systems,
Siebel,
SugarCRM,
Surado,
ACCPAC,
ACT!,
amdocs,
Appshore,
Aprimo,
Ardexus,
Astea,
Aurum,
Chordiant,
Commence CRM,
CSG Systems,
Dendrite,
eGain,
Everest,
Infor,
JD Edwards,
LeGrand,
NetOffice,
Peoplesoft,
SalesJunction.com,
Salesnet,
Visitar,
Infusion Software,
Dataforce CRM,
BrainSell,
Zoho,
LeadMaster,
Model Metrics,
PipelineDeals,
Tour de Force,
VanillaSoft,
Balgord Software Solutions,
Landslide,
C2CRM,
CRMG,
24SevenOffice,
CNP,
PhaseWare,
Enterprise Wizard,
Revelation,
Exact Software,
Majestic,
Epicor,
Goldmine,
Consona CRM,
TechExcel,
Commence,
ePartners,
Stay-In-Front,
Pivotal,
SAP,
Workbooks,
RunE2E
|